How it works
One honest picture of every job site's hazards
PlanIT Control pulls live hazard data for 55 real Florida power plants, stops work when lightning gets close, and tells supervisors each evening whether tomorrow is go, caution or no-go.
The problem
Hazard data is scattered across agencies, so go/no-go calls get made on instinct.
A utility foreman deciding whether a crew should set up a bucket truck tomorrow would need to check a weather app, NWS alerts, a lightning map, FEMA flood maps, fire satellites and whatever the last crew said. Nobody has time for that at 6 AM, so the call is often a gut feeling.
Before
Gut call
With PlanIT
One score + rules
Go / Caution / No-go
Data sources
Nine sources, each checked as often as it actually changes.
GOES-19 GLM
NOAA satellite lightning
Every lightning flash over Florida (plus 30 mi), with its exact time and place. Drives stop-work alerts.
Every 20 s
Open-Meteo
Weather model forecasts
Heat index, temperature, humidity, rain (past 72 h and next 24 h) and soil moisture for each site.
Hourly
NWS alerts
National Weather Service
Active watches, warnings and advisories (flood, heat, storms, red flag) that cover each site.
Every 5 min
FEMA flood zones
National Flood Hazard Layer
Whether a site sits in the 1%-a-year (high-risk) floodplain.
Once per site
USGS rivers
National Hydrography Dataset
Whether a named river is within 1 mile.
Once per site
NASA FIRMS
VIIRS fire satellites
Fire detections in the last 24 h, nearest distance and count within 25 mi. Needs an API key.
Every 30 min
iNaturalist
Wildlife sightings
Alligators and venomous snakes seen within 5 km (about 3 mi) in the last 30 days.
Every 6 h
Crew reports
Field crews in this app
Photo, pin and category from the field. A report within 2 mi in the last 48 h raises the matching hazard (flooding, heat, ground, fire, wildlife) to at least Watch; downed lines get their own crew-hazards card.
Live
EIA-860M
U.S. Energy Information Administration
The 55 real Florida power plants we track: largest first, with regional minimums.
Loaded once
If a source fails, the last good reading keeps being shown with its "as of" time, and the card is flagged when the reading gets old. A source with nothing yet shows "No data", never a made-up zero.
Stop-work rule
Lightning within 10 miles stops work. The 30-minute countdown restarts with every new strike.
- Any flash within 10 miles of a site starts a stop-work alert.
- All clear = the latest strike + 30 minutes. Each new strike pushes it later.
- The countdown uses when the lightning struck, not when our server read the file, so late or out-of-order satellite data can never shorten it.
- The check runs every 20 seconds even with no lightning, because the all-clear is triggered by silence.
6:00 strike, 6.6 mi
Alert starts · all clear 6:30
6:12 strike, 3.2 mi
Countdown restarts · all clear 6:42
6:05 strike, file arrives late
Would end at 6:35: ignored, the countdown never gets shorter
Result
One continuous stop-work, 6:00 to 6:42. All clear at 6:42.
In a real replay of the August 4, 2025 storm, 21 of 55 sites got stop-work alerts. The busiest, Okeechobee Clean Energy Center, reset 177 times and cleared exactly 30 minutes after its final strike. Every reset is logged, so a safety manager can audit why a crew was stopped and when it was cleared.
The hazard index (0–10)
One number per site for today and tomorrow, in three fixed bands.
Low
0 to < 4
Elevated
4 to < 7
High
7 to 10
A hybrid: the highest risk wins
- The model learns storms and floods from the forecast, turning its estimated probability into a 0–10 weather score. An index of 7 does not mean a 70% chance.
- Take the highest score from the model, OSHA heat-index bands, wildfire detections, wildlife and crew reports. A mild forecast can never average away dangerous heat or a reported hazard.
- Official NWS warnings set minimum scores: at least 9 for a Hurricane Warning, 7 for other supported warnings, and 4 for watches or advisories. Floors only raise a lower score. A nearby downed-line report also sets today's minimum to 7; our flood-risk alert sets it to 4.
- Lightning stop-work overrides today's index to at least 9.0. The stop-work engine runs independently; no model forecast can shorten or clear its wait.
- Tomorrow uses tomorrow's forecast, peak heat, and watches or warnings in effect then. Today's crew-report floors, advisories and lightning stop-work do not carry over. If the model cannot score, safety rules still run.
Hybrid rules from the model service
The hazard index is the highest of: the ML weather score (the model's calibrated probability mapped to 0-10), the OSHA heat-index band, and the wildfire, wildlife and crew-report rules. An NWS Hurricane Warning raises it to at least 9; another NWS warning (flood, flash flood, severe thunderstorm, tornado, tropical storm, extreme heat, red flag) or a downed-line crew report to at least 7; an NWS watch or advisory, or our flood-risk alert, to at least 4. While a site has an active lightning stop-work, today's index is at least 9. Every factor says whether it came from the model or a rule.
Machine learning model
A model estimates the chance of a crew-relevant hazardous weather day: NOAA Storm Events logs a storm, flood or other hazardous weather near the site. It mainly learns storms and floods; it does not predict injuries or the time of a lightning strike.
It learns from archived Open-Meteo forecasts matched against NOAA Storm Events, using the same kind of forecast it receives live.
Trained on 2022–2023 across 55 sites (40,150 site-days, 1,152 reported hazardous days). Calibrated on 2024; tested on 2025, kept out of training and tuning.
Compared with two baselines
The model's same-day PR-AUC is 4.0× Climatology; 3.2× Simple rule. This measures how well rare hazardous days rise to the top, not percent accuracy.
| Method | PR-AUC ↑ | ROC-AUC ↑ | Brier ↓ |
|---|---|---|---|
| Hazard model (LightGBM)Calibrated probability from the weather forecast, season and site. | 0.1285 | 0.8419 | 0.02219 |
| ClimatologyThe training years' hazardous-day rate for that calendar month. | 0.0318 | 0.6154 | 0.02319 |
| Simple ruleFlag the day if forecast rain is at least 1 in or the heat index reaches 108°F. | 0.0396 | 0.5994 | 0.02308 |
PR-AUC and ROC-AUC measure ranking; higher is better. Brier measures probability error; lower is better. Reported hazards occurred on 2.37% of test site-days (476 of 20,075).
Day-ahead results and label definition
| Method | PR-AUC ↑ | ROC-AUC ↑ | Brier ↓ |
|---|---|---|---|
| Hazard model (LightGBM) | 0.1021 | 0.8253 | 0.02271 |
| Climatology | 0.0318 | 0.6154 | 0.02319 |
| Simple rule | 0.0338 | 0.5644 | 0.02313 |
— = not evaluated. A site-day is one site on one local calendar day.
Label: NOAA Storm Events crew-relevant event within 15 mi or in the site's NWS zone/county, by site-local date
Weather input: Open-Meteo gfs_seamless (HRRR over Florida); training on the Historical Forecast API
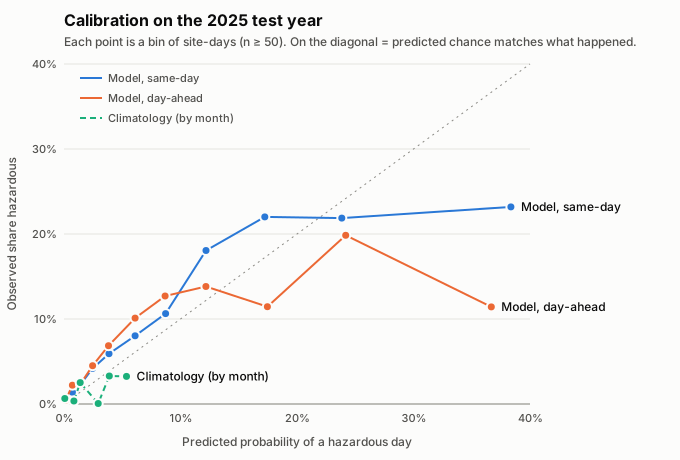
The diagonal is a perfect match between predicted and observed chances. The model is better at ranking days than estimating exact probabilities; the highest probabilities can be overconfident.
Model evaluation limits
- The label is "NOAA logged a hazardous-weather event", not "it happened": rural sites and nights are under-reported, and lightning is logged only when it causes damage or injury.
- Location is partly reporting bias: areas near people get more reports, so the model rates them riskier. That's why "Area with frequent past severe-weather reports" can be a top factor.
- Heat isn't learned (NOAA logged Florida heat only in 2022-2023), so heat comes from the OSHA rule.
- Wildfire is barely predicted by weather alone, so fires come from the satellite-detection rule.
- Two training years, one calibration year (2024, with three hurricanes) and one test year: very high probabilities (above ~20%) run over-confident in ordinary years.
- Much better at ranking days than at exact probabilities: 4% Brier skill over monthly averages today, not significant a day ahead.
Honest limits
What this system can't tell you, so nobody over-trusts it.
Rainfall is a model estimate.
Open-Meteo rain totals come from weather models, not a rain gauge at the site. Real totals can be higher or lower.
Wildfire depends on satellite passes.
VIIRS satellites see a given spot only a few times a day, so a new fire can burn for hours before it shows up. Hot spots within 1 km of a plant are treated as plant heat and ignored, so a real fire inside that ring would be missed. Without a FIRMS key, wildfire data is off and the card says so.
It predicts hazardous weather days, not injuries.
A high index flags conditions to check; it does not mean someone will get hurt. A low index does not mean a site is safe. It supports a supervisor's judgment; it doesn't replace it.
Lightning positions are approximate.
Satellite pixels are about 8–14 km across, so a strike reported at 9.8 mi could be a little closer or farther. A strike reaches us 20–40 seconds after it happens.
Hazardous days are rare, and exact probabilities are uncertain.
There are few reported events to learn from. The model ranks risky days better than it estimates exact chances; the highest probabilities can be overconfident. Day-ahead probability gains over the baselines are not statistically conclusive.
Reporting bias affects the model.
NOAA records reported events, not every event that happened. Rural sites and nights are under-reported; lightning is usually logged only after damage or injury. Location partly reflects where reports come from, so a low score at a remote site is weaker evidence of a quiet day.
Heat and wildfire cannot be learned reliably from these labels.
Heat reports are too sparse to validate the model's heat predictions, and weather alone captures wildfire poorly without drought or fuel conditions. OSHA heat bands and satellite fire detections supply the safety rules for these hazards.
Replay mode
A real recorded storm, played through the real pipeline, at 30× speed.
Lightning doesn't strike on cue for a demo. Replay takes an hour of real GOES-19 satellite files from a past Florida storm and feeds them, one by one, through the same code the live system uses. A simulated clock starts at the storm's first file and runs 30× faster, so an hour of lightning plays in about two minutes.
Live
Replay
Same pipeline
Dashboard
- Why the real pipeline: it proves the code that protects crews actually works, and it gives exactly the alerts crews would have seen that evening. The alert engine has no clock of its own; it runs on whatever time it's given.
- Replay alerts are stored separately and never mix with live ones. Real lightning keeps being tracked during a replay: real alerts stay on screen next to the replay's, which are tagged REPLAY.
- After the last file, replay runs 31 quiet simulated minutes so every countdown can finish.
- Heat, rain, fire and wildlife stay live during a replay; only lightning is replayed.